Network Packet Loss & Latency Monitoring on Roblox Cloud
by Praveen Ponakanti
Product & Tech
The Roblox Network Engineering team maintains a large, fast-growing network with data center and point of presence (POP) sites distributed across the globe. Delivering a great user experience on the Roblox platform is dependent on the performance and reliability of this network. It is critical for network operators to be able to troubleshoot and detect problems in the network, and have visibility into the network performance. Network monitoring is generally achieved by periodically collecting device stats, error metrics, and syslogs, and storing them in a time series or log database. The data is collected with either a push or pull model using standard protocols like SNMP, Netconf, Rest APIs, or Streaming Telemetry.
Network fault detection solely through device telemetry has several shortcomings, as it’s a passive monitoring technique. It’s dependent upon the ability of the network nodes to identify and report anomalous situations as soon as they occur. The device may not always report back the data or, in some cases, might not have all its health stats exposed to the usual telemetry collection methods. Additionally, network devices may sometimes provide erroneous data or silently black-hole traffic. A major limitation with device telemetry is that it provides very little visibility into the end-to-end reachability, packet drop, and latency statistics of the network.
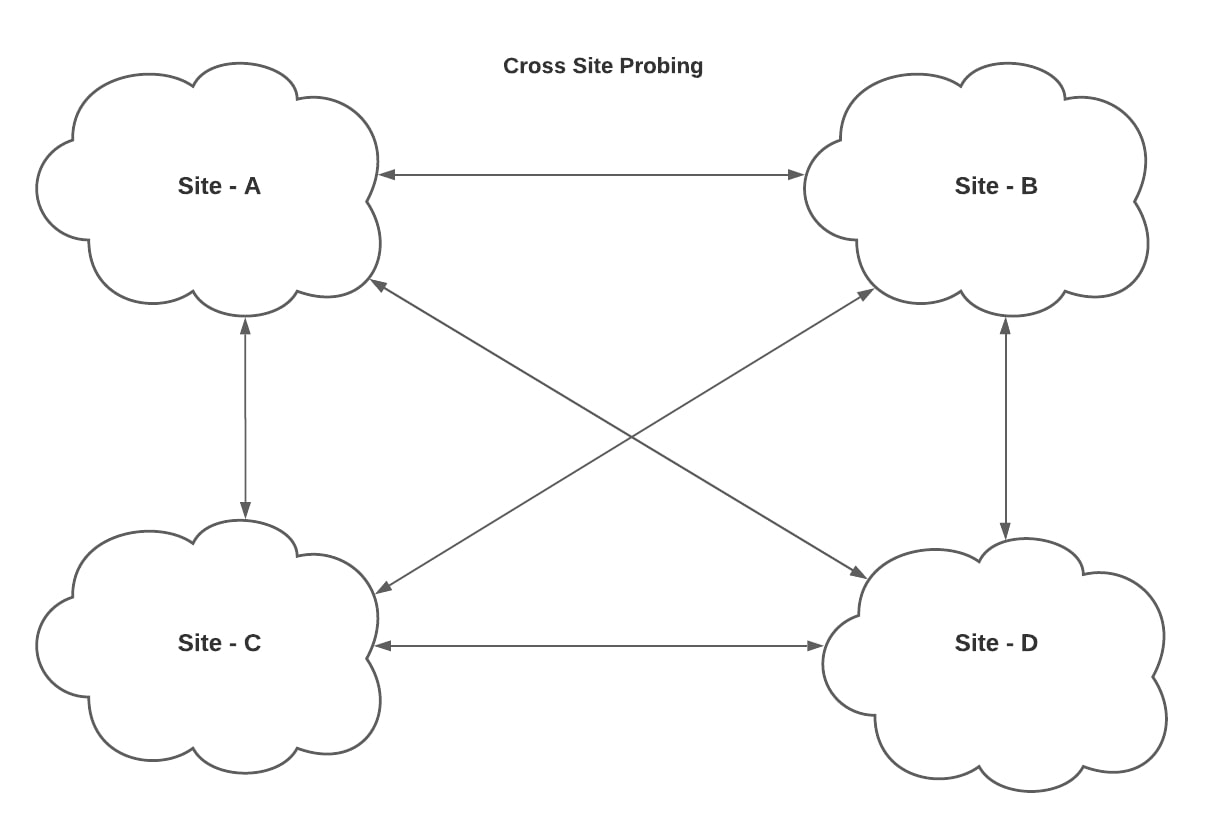
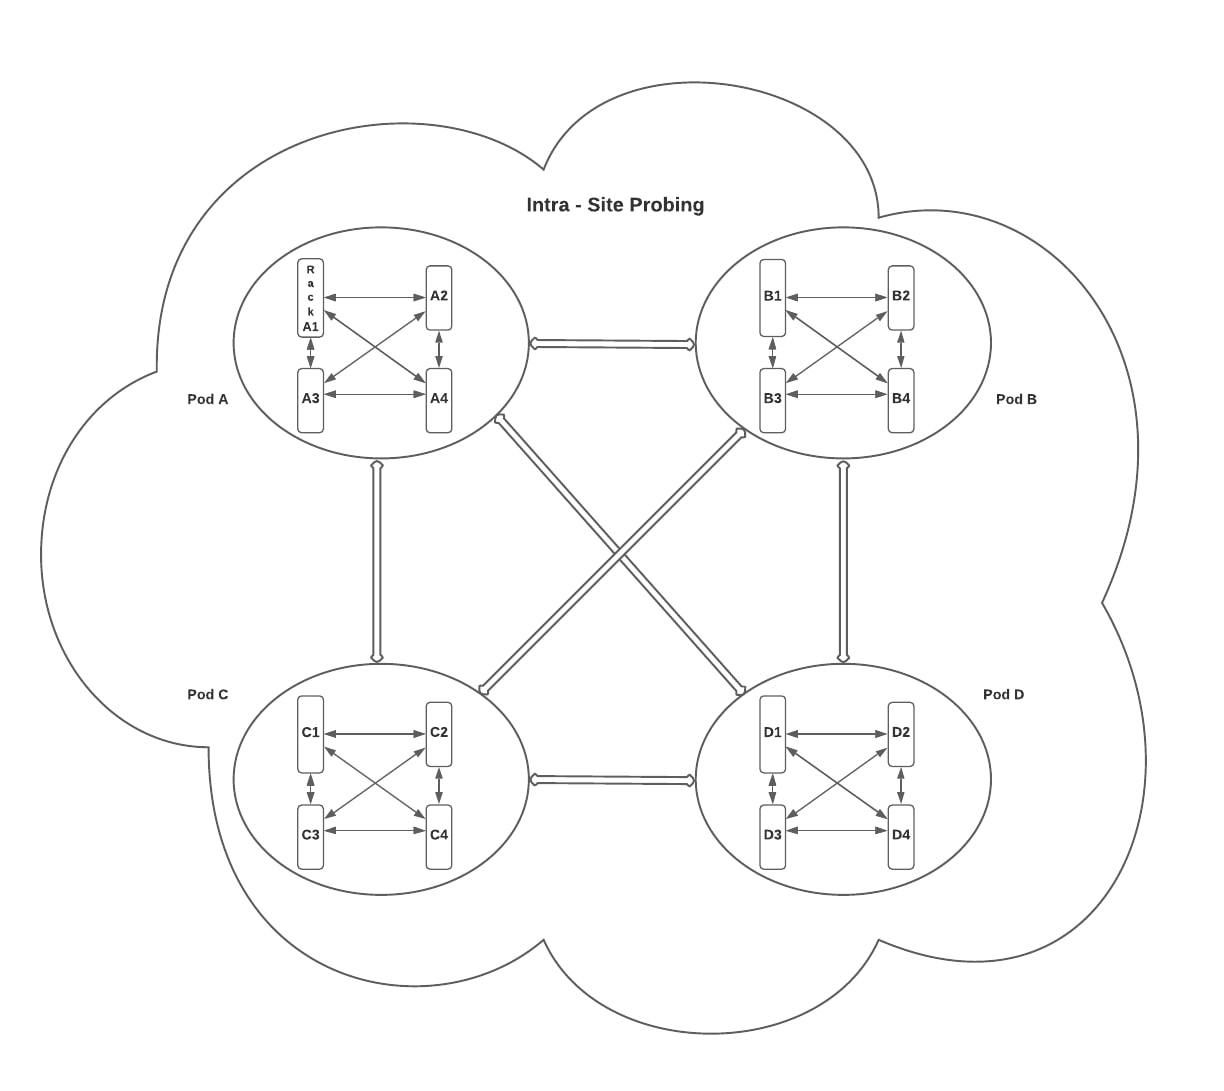
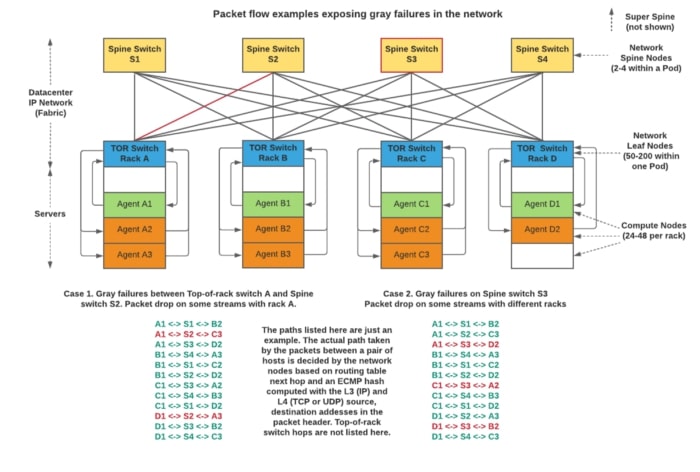
A great way to actively monitor a network is by regularly transmitting synthesized probes across a mesh as depicted in the figures below.
While troubleshooting production outages, network operators are frequently asked questions like, “Is the network dropping packets?” or “Is there an ongoing network fault impacting service connectivity?” In order to answer this type of question without access to historical packet loss and latency data, they would need to investigate a large set of links and nodes within the network.
Designing a reliable and scalable network mesh monitoring system
For a black box network monitoring system to be effective in detecting packet loss or latency spikes, it requires continuous probing over different parts of the network. Data center networks utilize all links between nodes for user traffic. Production network devices run BGP and load-balance traffic over multiple equal-cost paths. Changes in the network topology are usually reflected within seconds by routing table updates under normal circumstances. To get an accurate measurement of network packet loss, the test probes should travel across as many paths as possible covering all network nodes and links. With a large network, like ours, that spans multiple sites across the globe, it isn’t scalable to probe between every pair of nodes or racks. The more sustainable solution we chose, that doesn’t compromise on the level of visibility, is to probe an N² mesh across racks within each site along with another N² mesh across all sites.
What do we probe the network with?
The test probes should emulate live traffic going through a production network. Most of the traffic on our network is either TCP, UDP, or HTTP, and each of these could potentially be used for probes. One of the problems with TCP probing is that it isn’t lightweight enough to scale to the number of connections needed to monitor a large network. Another catch with TCP is the built-in flow-control and sliding window-based transmissions result in a variable probe transmit rate which isn’t ideal for quantifying or detection of momentary packet drops. ICMP, which is used by ping and traceroute, is typically rate-limited on the servers or network nodes. This caps the aggregate rate of ICMP probes that can be used. HTTP requests are higher up in the application layer and dependent upon some factors outside the network such as server or application performance. HTTP adds an extra variable factor to the results that is difficult to separate out. The goal with this system is to monitor the performance of the underlying network infrastructure that primarily operates at OSI layers 4 and below. We chose UDP probes for these reasons in addition to it being the primary transport layer protocol on our network.
Where do we probe from?
One way to achieve a large aggregate probe rate and also cover a large number of network paths is to utilize as many compute nodes as possible to transmit the probes. This has two advantages: it helps distribute out the load on the systems that are generating the probes, and it expands the number of network ports carrying them. However, this requires an agent that is very stable and as thin on the host system’s resources as possible. At the same time, the agent should be capable of accurately measuring packet loss and latency on multiple paths without being impacted by CPU, memory, or I/O utilization swings on the host system. The agent has to constantly maintain this delicate balance between being lightweight and highly performant.
How do we measure network loss and latency?
This may appear to be a trivial computation over a single stream of probes, however, there are some challenges that arise at scale that are not immediately obvious. To scale to such a large mesh, the agent needs to compute fast and accurate transmit (Tx) and receive (Rx) packet counts with timestamps over numerous streams simultaneously. It’s important that network loss metrics do not include packets that are lost at the host running the agent when its CPU is busy or its network buffers overflow. Network latency needs to be computed with the total time the probes were on the wire or intermediate network nodes, while excluding the time spent waiting in I/O buffers and agent process pending OS scheduling.
Roblox’s Ping Mesh system
The need for black box network loss and latency monitoring has existed since the growth of public and private cloud infrastructure. An off-the-shelf solution that can scale to our large network has proven difficult to find. Several large cloud operators and network tooling providers have designed their own solutions to monitor network loss and latency. We tried out some openly available tools, but ran into problems with stability and scalability while obtaining only limited visibility into network performance. This led us to build our own mesh monitoring system which has provided better detection of low-frequency errors with low overhead. Some of the highlights of our system are:
- We chose Go to implement all the components of our system and that helped achieve a high level of performance while using minimal system resources.
- Our agents are highly stable and can run on a wide range of production hosts, including those that are performing critical services on the Roblox platform like traffic, caching, and application servers.
- The agent is optimized to batch packet I/O operations with Go wrapper functions over the Linux sendmmsg() and recvmmsg() system calls, which enables it to transmit a high rate of probes with low overhead. Every agent in our deployment simultaneously transmits probes to up to 100 other hosts, at a rate of 100 packets per second (PPS). The agent transmits packet bursts every second to each destination.
- Probes carry different type-of-service (TOS) field values in the IP header to each destination and are accounted separately for packet loss and latency over the network. Each packet burst includes a mix of multiple TOS values to every other destination. This helps monitor network performance for different quality-of-service (QoS) classes.
- The agent can detect network drops as low as 1 in 6000 packets per minute on each probe path. Packet loss within the core or edge of the network lasting under 1 second long can be detected, such as those during a BGP flap.
- Probe packet drop charts mimic those of network device interface error rates when the errors are responsible for the drops. We have been able to discover traffic black-holing bugs in the network that are difficult to detect.
- The agents use NIC kernel read timestamps to attain high accuracy on network latency measurements. A consistent round trip intra-site latency of 50–100 microseconds can be measured while excluding host OS scheduling latency and network clock drift.
- Low CPU utilization and memory footprint. The agent uses less than 25% of a single core at peak transmit and receive rates (5 kpps each). Most of the deployed agents use only around 5% of a core. Only 10MB heap memory is needed to manage the agent’s Tx and Rx packet buffers and counters. When the network grows we can scale vertically or horizontally by tweaking the limits or adding additional agents.
- The agent is rarely impacted when the host system is under stress. We have obtained accurate results even when host CPU load approached 99% on several occasions.
- Telemetry is collected from each agent to monitor their health. Agents can identify problematic situations such as when the host system reboots, when the agent process restarts, or when packets drop due to socket buffers overflowing.
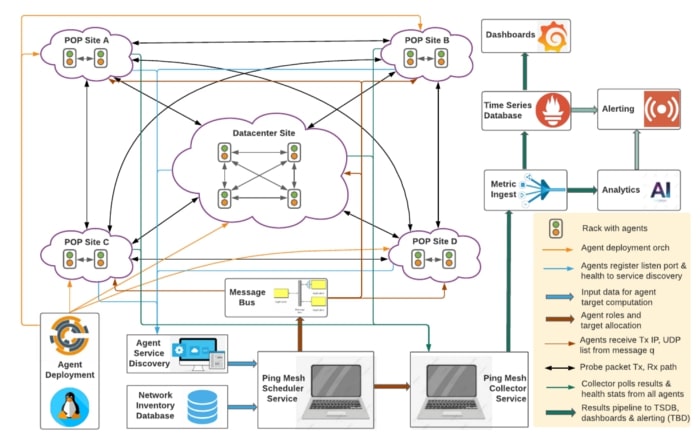
The agents are deployed with Chef on a wide set of server clusters to maintain a high number of nodes participating in network probing. The agent binary is run and managed with systemd on Linux so that it gets auto-restarted after a host reboot or agent upgrade. The mesh scheduler dynamically detects and adjusts streams as needed when any one of the agents goes down or new ones come up. Our scheduler application periodically polls device inventory and a service discovery system to detect new agents and server health status before allocating targets for Intra-Pod, Intra-Site, and Inter-Site probing. A message bus is used to communicate the target host list to each agent that is transmitting test probes. Individual streams that originate or terminate at a specific rack are distributed among all available agents within that rack. This helps us exercise a large amount of equal cost paths within our network fabric, as shown in the figures below.
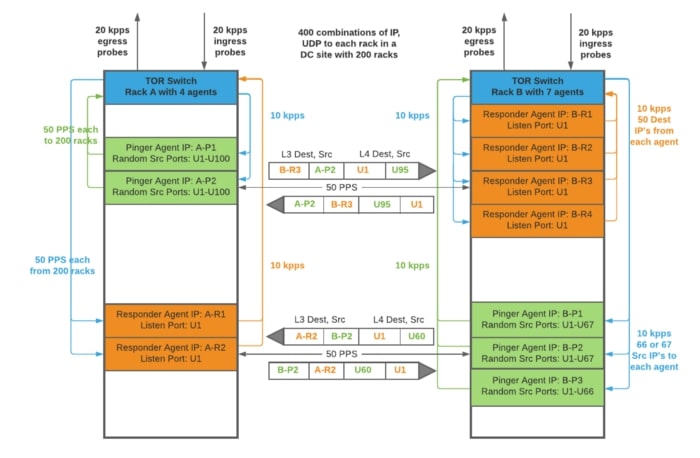
We started with 150 agents in our first deployment, and now have successfully expanded 10x. The mesh covers our backbone interconnecting 25 sites spread out across the globe. At one of our primary data center sites we have an intra-site mesh covering 200+ racks with about 33,000 streams aggregating to a 1.65 Mpps probe rate. Each rack receives 5–10 kpps of probes from other racks. The scheduler application computes and evenly distributes over 35,000 targets across all our agents in different sites.
Data collection and visualization
We run a separate collector application that periodically polls all the Ping Mesh agents for packet loss and latency results. This data is automatically filtered to exclude invalid results based on the health states cached locally at the collector. For example, we exclude results from an agent running on a server that didn’t respond to health checks or a server that just rebooted. Our collector can synchronously poll and filter results from over 1,500 nodes and then ingest the data to a time-series database within 2 seconds.
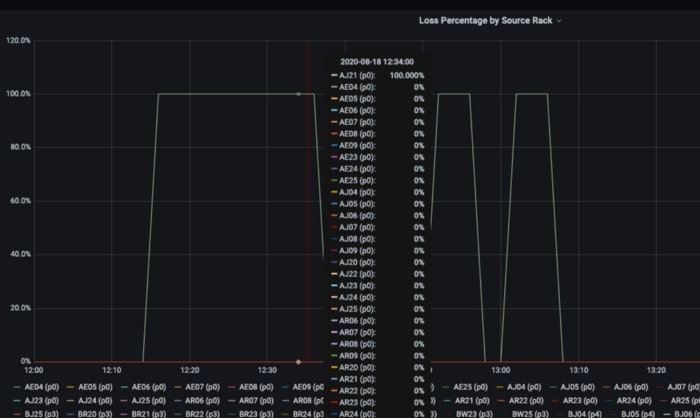
Both aggregated and per stream results are visualized with the aid of Grafana dashboards. Heatmap grids can be difficult to use with large sets of data, particularly for our large data center site. We utilize a Prometheus topk() query to display the paths with the highest individual packet drop among thousands of results, which are generally just a handful. The results are extensively vetted against agent and host system health stats that are frequently polled by the collector. This gives us a high level of confidence on each individual result irrespective of how large the packet drop variations are. The individual results when viewed together can give us clues on where the network fault occurred. Some examples of packet loss that were caught by our mesh monitoring system are displayed below.
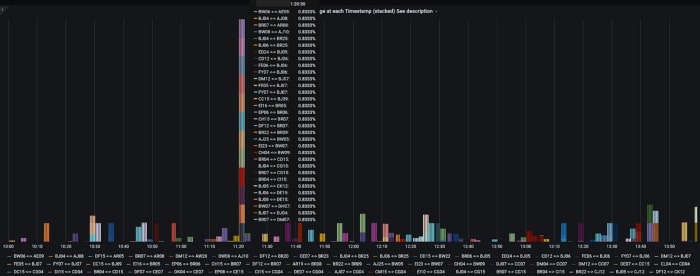
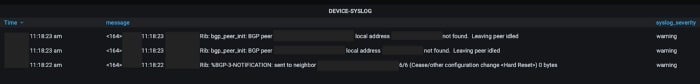
The packet loss captured above lasted just 1 second long and coincides with a BGP session reset that occurred on one of the links on the pod switches connecting those racks to the rest of the fabric.
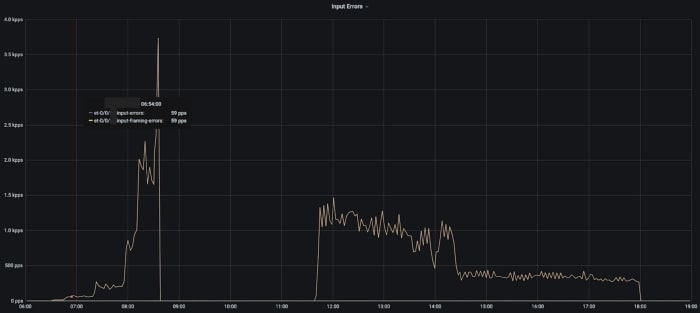
Packet loss measured by our test probes to a specific rack at a data center site over a few hours. This was not customer impacting and was below the threshold set for auto-draining of the network link.
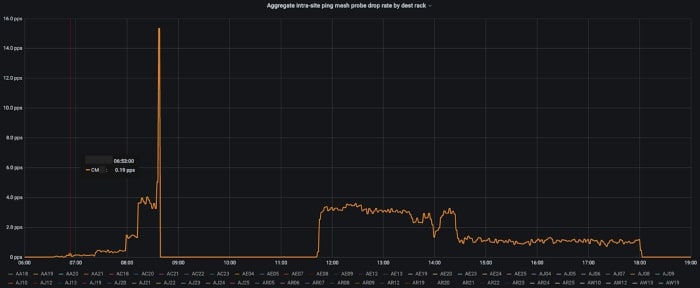
Comparing that chart with interface error rates on the link between the rack’s TOR switch and fabric switch before it was drained.
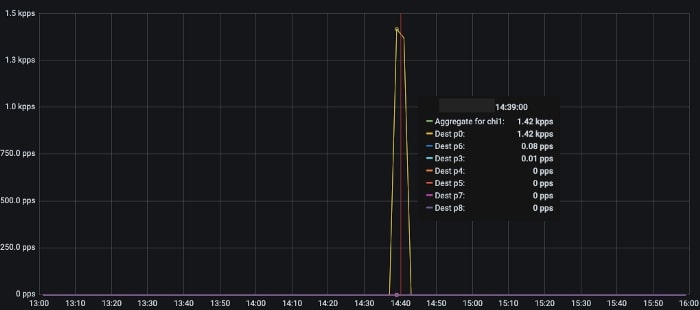
Short duration but heavy packet drops during a line card failure on a switch inside the DC fabric.
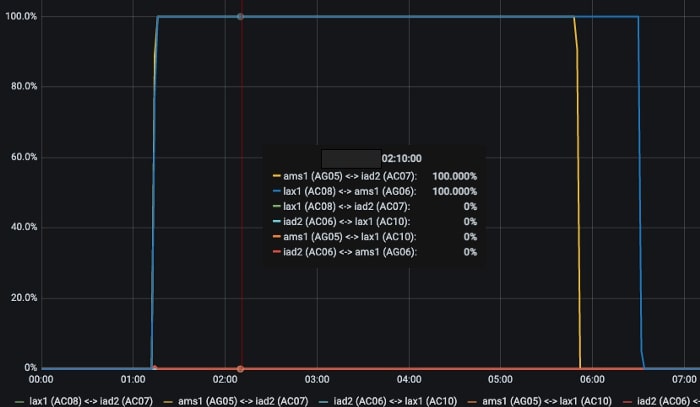
Traffic black-holing on specific streams in the backbone network on separate occasions.
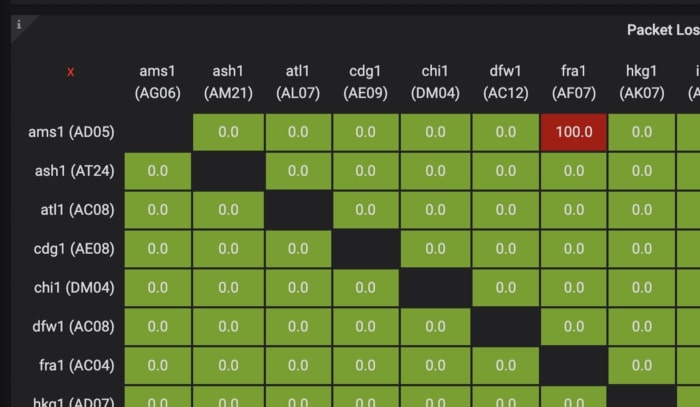
Traffic black-holing within the DC only between a specific rack and destination IP
Summary and next steps
Our Ping Mesh system has been a powerful tool for the Network Engineering team to monitor end-to-end packet loss and latency. This data can be used to instantly answer the question, “Is the network dropping packets?” Based on our experience, major customer-impacting network incidents are usually detected and alerted by the device telemetry monitoring system. Low-impacting but potentially problematic issues with network buffering or isolated traffic black-holing are brought to light with this system.
Our system can also provide insights into the overall reliability of the Roblox Cloud Network. At one of our major data center sites, we have over 100 million probes per minute monitoring the health of the network and we rarely hit a packet loss count greater than 50 per minute. This indicates about 6 9’s of reliability (99.9999%) from our data center network. Quite frequently, no packet drop is noticed among the 100 million packets. When a significant amount of packets are lost this system provides insights into where and how long the packet drop occurred. An auto-remediation engine self-heals the network and prevents user traffic from experiencing further drops by redirecting it through a different path in the network. The Networking team at Roblox has built an extremely reliable cloud network.
In the future, we intend to utilize an analytics engine to correlate data from device telemetry, syslogs, and other data sets. Then we plan to compare that with Ping Mesh data to help isolate where the network fault occurred. As Roblox’s cloud network continues to expand and evolve we plan to enhance our probing mechanisms to include IPv6 and jumbo frames, while adding more agents to increase inter-site coverage.
— — —
Praveen Ponakanti is a Principal Engineer at Roblox working on traffic and network infrastructure. He has driven the development of network monitoring & alerting services on large scale cloud platforms, as well as system software on data center networking gear. He holds a master’s degree in Computer Engineering from Santa Clara University.
Neither Roblox Corporation nor this blog endorses or supports any company or service. Also, no guarantees or promises are made regarding the accuracy, reliability or completeness of the information contained in this blog.
©2021 Roblox Corporation. Roblox, the Roblox logo and Powering Imagination are among our registered and unregistered trademarks in the U.S. and other countries.